

Understanding System Health: A Look at Monitoring Methodologies (USE, RED, and Google's Four Golden Signals)

In today's complex technological landscape, ensuring the reliability and performance of systems is paramount. Effective monitoring is the cornerstone of this effort, allowing teams to quickly identify, diagnose, and resolve issues before they impact users. This article will explore various prominent monitoring methodologies, including the USE Method, RED Monitoring, and Google's Four Golden Signals, highlighting their strengths and applications.

Why Are These Methodologies So Important?
It's very common in SRE and DevOps interviews to be asked about observability – not just about what metrics you collect, but how you approach system health. Instead of merely naming individual metrics, demonstrating an understanding of established monitoring processes and methodologies like RED, USE, and Google's Golden Signals showcases a structured and thoughtful approach to collecting and interpreting key metrics.
These methodologies provide a framework for:
Systematic Troubleshooting: Knowing which methodology applies to a given component helps you quickly narrow down potential issues.
Effective Communication: Using a recognized framework ensures all team members understand the language of monitoring.
Proactive Problem Detection: By focusing on the right signals, you can often detect degradation before it escalates to an outage.
Performance Optimization: Identifying bottlenecks or inefficiencies becomes much clearer with a defined set of health indicators.
For instance, when addressing a service-related issue, your focus will naturally gravitate towards RED metrics: "If it’s a service that I'm focusing on, I'll prioritize Request Rate, Error Rate, and Latency metrics." This applies broadly to web services, APIs, or microservices.
Conversely, for underlying infrastructure components, the USE method becomes indispensable: "If it’s an infrastructure component, for example, a Kafka cluster or a server's CPU, my focus will be more on resource utilization and saturation." This is incredibly useful for diagnosing performance of databases, message queues, virtual machines, or even specialized ML infrastructure where resource contention is a frequent concern.
Understanding when and why to apply each methodology demonstrates practical expertise in building and maintaining resilient systems.
Google's Golden Signals: The Foundation for SRE
Google, a pioneer in site reliability engineering (SRE), has championed a set of fundamental metrics known as the Four Golden Signals:
Latency: The time it takes to serve a request. This includes the time spent processing the request and the network transit time. High latency can indicate bottlenecks or performance degradation.
Errors: The rate of requests that fail, either explicitly (e.g., HTTP 500 errors) or implicitly (e.g., incorrect responses). Monitoring error rates is crucial for identifying system failures and regressions.
Saturation: How "full" your service is. This can be measured by looking at resource utilization (CPU, memory, disk I/O, network bandwidth) or by observing queue lengths. High saturation often precedes performance degradation or outages.
Traffic: The amount of demand being placed on your system. This could be measured in requests per second, bandwidth usage, or concurrent users. Understanding traffic patterns helps in capacity planning and identifying unusual activity.
These signals provide a comprehensive overview of a service's health and are foundational for effective SRE practices.
The USE Method: A Resource-Centric Approach
The USE Method (Utilization, Saturation, Errors) is a simple yet powerful methodology primarily focused on monitoring system resources. It's particularly useful for diagnosing performance problems within individual components or hosts.
Utilization: The average time that a resource is busy. For example, CPU utilization measures how busy the CPU cores are. High utilization might indicate a bottleneck, but it's not always a problem on its own.
Saturation: The degree to which a resource has more work than it can handle, often indicated by queue lengths. For instance, a high disk I/O queue suggests disk saturation, meaning requests are waiting to be processed.
Errors: The count of error events. This could be hardware errors (e.g., disk errors, network packet errors) or software errors reported by the system.
The USE Method is excellent for quickly identifying resource-related issues. If any of these metrics for a given resource are abnormal, it's a strong indicator of a potential problem.
RED Monitoring: Tailored for Request-Driven Systems
As highlighted in the provided image, RED Monitoring is a subset of Google's Golden Signals, specifically adapted for request-driven systems and microservices. It's credited to Tom Wilkie and is composed of:
Rate: The number or size of requests on the network and system. This can encompass various protocols like HTTP, SOAP, REST, or middleware messaging queues. Monitoring rate helps understand the load on the system and can reveal unusual traffic patterns. Any environment that can fail on peak traffic is a target for rate monitoring.
Errors: Problems that cause an incorrect, incomplete, or unexpected result. This includes code failures, application-level bugs, peak load bugs, and communication woes. Errors need rapid responses and often require deep, high-fidelity insights to diagnose effectively.
Duration: This metric focuses on bringing events into causal order, often referring to the latency of requests. Both client-side and server-side measurements are important. This is typically measured through distributed tracing, user experience monitoring (RUM), and application performance monitoring (APM) tools, helping to understand the end-to-end time taken for a request and pinpoint where delays occur.
Why RED?
RED monitoring provides a focused and actionable set of metrics for modern, distributed architectures. By concentrating on rate, errors, and duration, teams can quickly gain insights into the health of their services from a request-centric perspective, which is crucial for microservices and API-driven applications.
Conclusion
Each of these monitoring methodologies offers a distinct lens through which to view system health.
Google's Golden Signals provide a holistic view for SRE.
The USE Method is invaluable for drilling down into resource-specific performance.
And RED Monitoring, a focused derivative, is particularly powerful for understanding the behavior of request-driven systems and microservices. By strategically implementing and combining these approaches, organizations can build robust monitoring strategies that ensure high availability, optimal performance, and a superior user experience.
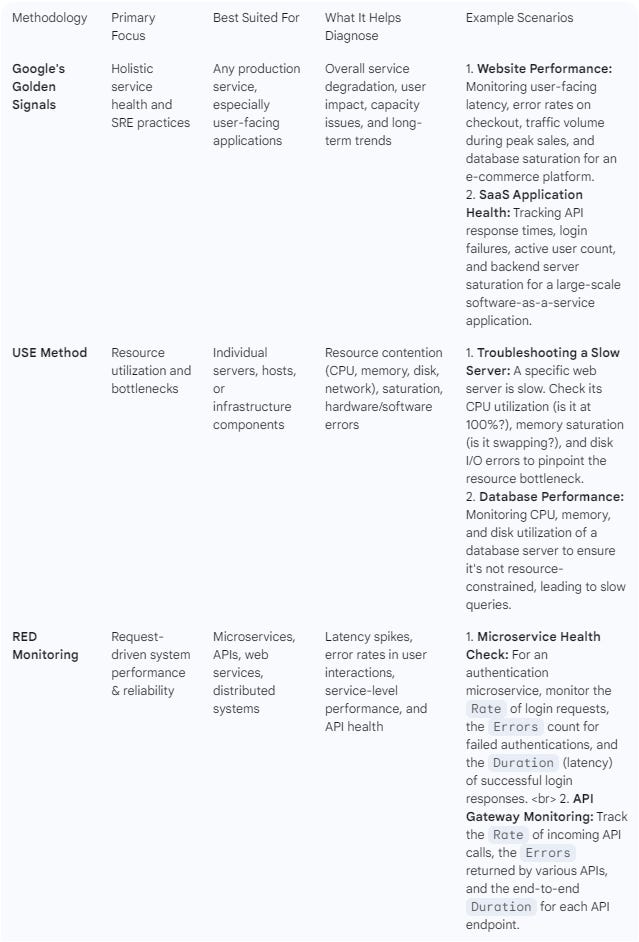
When to Use What: A Quick Guide
Further Reading
For those interested in diving deeper into these monitoring methodologies, here are some valuable resources:
Google's Golden Signals (from the SRE Book):
Google's Site Reliability Engineering Book: Monitoring Distributed Systems - https://sre.google/sre-book/monitoring-distributed-systems/
This chapter provides the definitive explanation of the four golden signals directly from Google's SRE team.
The USE Method:
Brendan Gregg's Blog: The USE Method - http://www.brendangregg.com/usemethod.html
Brendan Gregg is a widely recognized expert in performance analysis, and this article is the original and most authoritative source for the USE Method.
RED Monitoring:
Tom Wilkie's Blog: The RED Method: How to instrument your services - https://www.weave.works/blog/the-red-method-key-metrics-for-microservices/
This article by Tom Wilkie, one of the creators of the RED Method, provides a direct explanation and context for its use in microservices.
Grafana Labs: Monitoring modern applications: RED method vs USE method - https://grafana.com/blog/2020/07/22/monitoring-modern-applications-red-method-vs-use-method/
This link offers a comparative perspective between RED and USE methods, which can be useful for understanding their complementary nature.